Mandelbrot Fractal Animation
 |
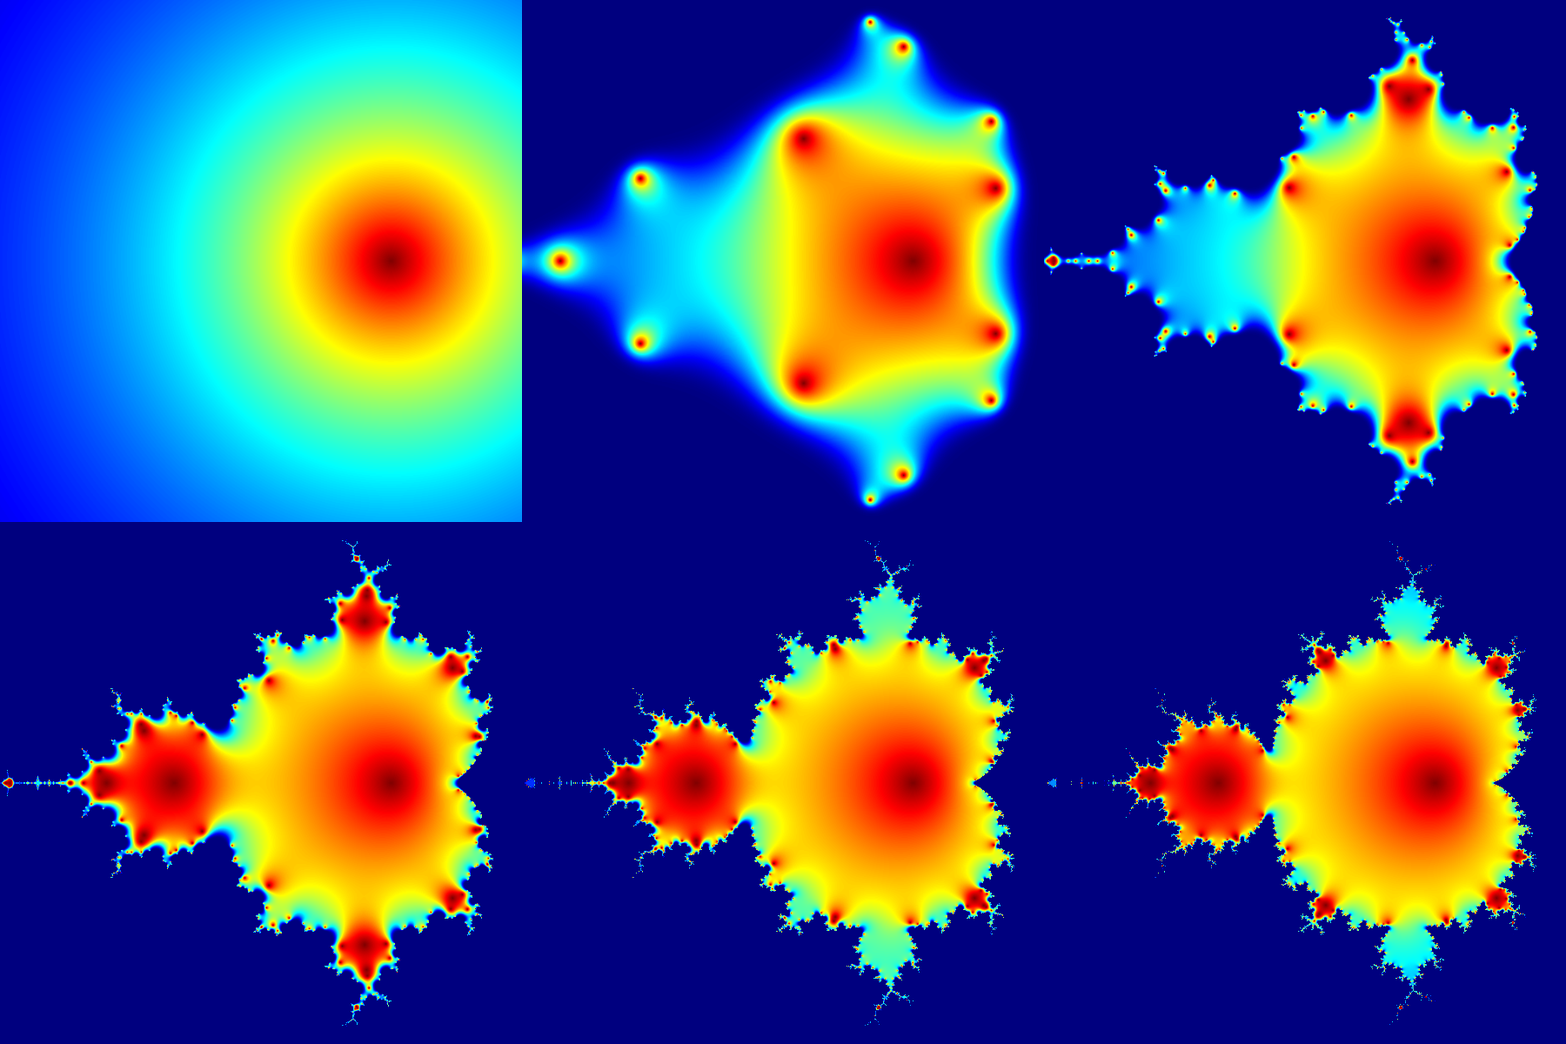
An animated diagram showing iterations of the equation used to generate the Mandelbrot set, a fractal first studied by Benoît Mandelbrot in 1979. The animation shows the values of Z for first 20 iterations of the equation
Z_{n+1} = Z_n^2+c
where c is a complex variable.
Mandelbrot set graphics are usually generated using the so-called "escape algorithm", where color is assigned according to the number of iterations it took for the equation to diverge past a pre-set limit, and black color is used for regions that never diverge. This, however, is a plot of a much simpler quantity: the actual values of the equation at the first 20 iterations. Every pixel in the image corresponds to a different value of a complex constant c ranging from -2.2 to 1 on the real axis (horizontal) and from -1.2i to 1.2i on the imaginary axis (vertical). Z is initialized to 0. At each iteration, the next value of Z is calculated using the equation above.
This graphic was generated with 13 lines of code in the R language (see below for the code). For each point, the magnitude (aka absolute value) of Z is calculated, than scaled using an exponential function to emphasize fine detail, and finally mapped to color palette (jetColors). Dark red is a very low number, dark blue is a very high number. The deep blue region "squeezing" in the boundaries of the fractal is the region where Z value diverges to infinity. © Jarekt Please see the licensing details.
Another Mandelbrot Fractal Animation
 |
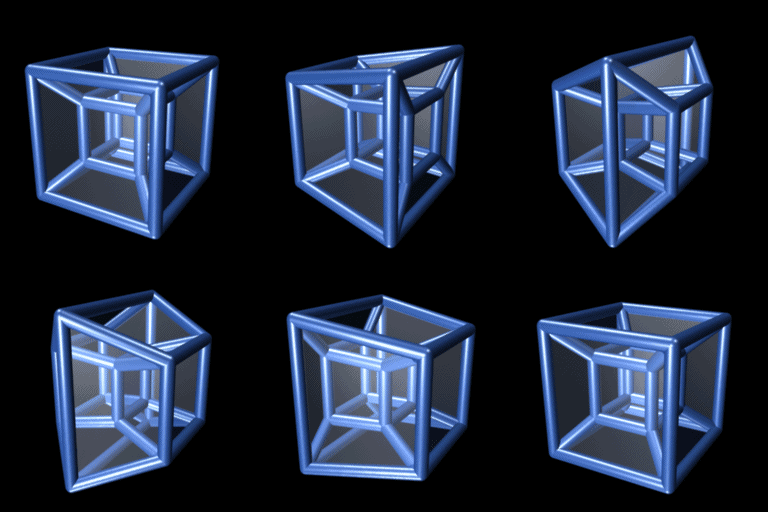
Created by user AlterVista from the German Wikipedia © AlterVista Please see the licensing details.
